Progress Report
Artificial generation of upstream maritime heavy rains to govern intense-rain-induced disasters over land (AMAGOI)[10] Environmental Monitoring
Progress until FY2024
1. Outline of the project
This project promotes public communication necessary for the realization of weather control, leveraging information science. By utilizing deep learning and visual information processing technologies, we aim to accelerate research on weather intervention through four-dimensional (4D) visualization of the processes behind local heavy rainfall and the effects of weather intervention. This visualization system will also contribute to the project's outreach promotions.
In FY2024, we worked on constructing a 4D visualization system intended to support the analysis of the effects of weather intervention. We regularly exchanged information and held discussions with meteorological researchers in Item 5, regarding the targeted weather phenomena and visualization methods. As individual development tasks,
- we developed advection modeling technologies targeting weather phenomena at both local and global scales
- we created a prototype application to visualize small-scale 4D volume data for specific regions and time spans, as determined through collaborative discussions.
2. Outcome so far
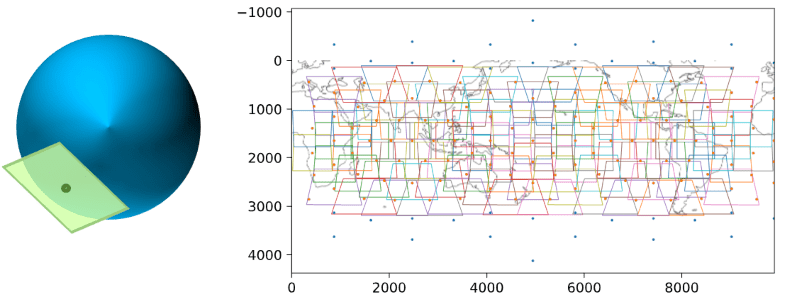
(1) Using technology developed in FY2023, we developed a technique for advection modeling at local and global scales. This technique is based on geometric transformations representing temporal changes in local areas over a few hours, extracted from the Global-merged IR product, which provides global brightness temperature observations. Specifically, the advection was modeled using a spatiotemporal kernel regression model on geometric transformation. This model takes as input a time and a 3D spatial coordinate on the spherical Earth and outputs a geometric transformation representing the advection at that point in time and space.
To illustrate the spatial variations of advection, Fig.1 shows the modeled advection represented at grid points over a 15-hour period within the ±60° latitude and 360 longitude range (color-coded from blue to red).
(2) To support the analysis of weather intervention effects, we developed a prototype application for visualizing the temporal changes in atmospheric ice and water vapor quantities. Specifically, we extracted 4D volume data for specific time periods and regions. Using middleware Unity, we constructed virtual scenes and implemented a custom I/O script that allowed the extracted 4D volume data to be imported into the virtual scene. Additionally, we developed a prototype application for visualizing this 4D volume data using the SONY ELF-SR2 spatial reality display.
In Fig.2, volume data before and after the intervention are shown on the left and right, respectively. The difference in the distribution of atmospheric ice (indicated in red) suggests an effect of the weather intervention.

3. Future plans
Other interventions under consideration in Item 5 include deploying kite-like resistive objects near the ground surface to weaken surface winds. In FY2025, we plan to use the advection modeling technology developed in FY2024 to model surface winds influenced by such resistive objects in a way suitable for visualization. We will then visualize the results using our prototype 4D visualization application.